Optimisation: CPU profiling
2024-01-15T17:00:00+00:00
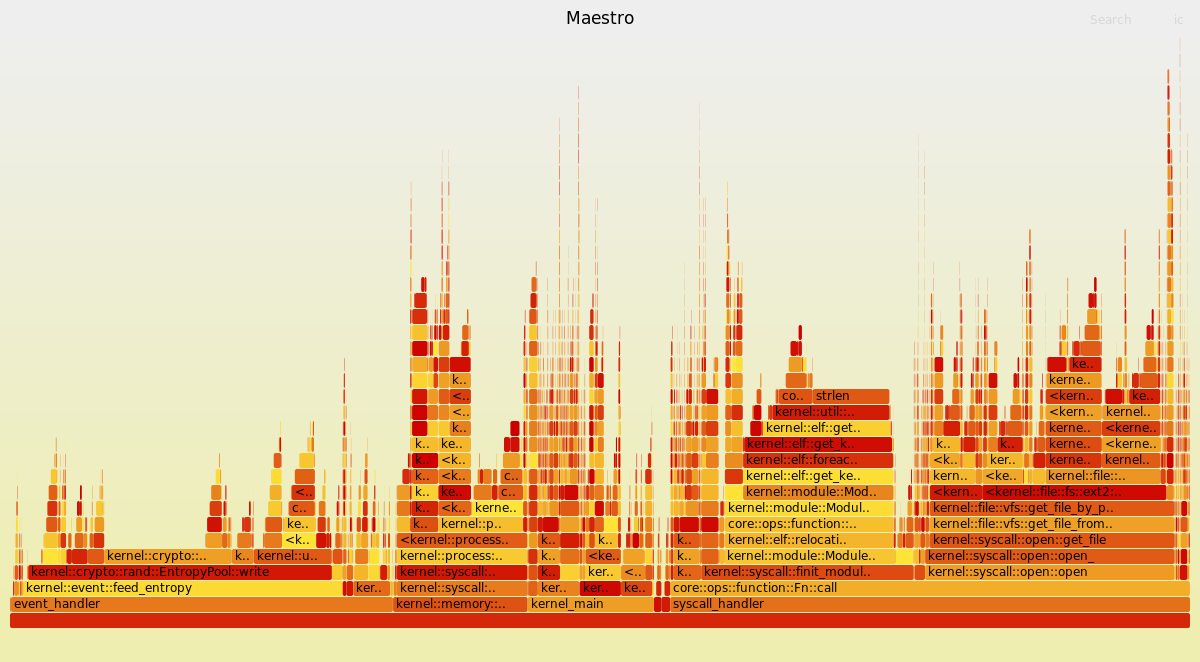
Visualisation of the kernel's booting sequence using a Flamegraph
In the previous article, I said the project needs cleaning up and optimisations.
Indeed, those of you who tested the OS with the provided .iso file probably observed that the system is very slow.
It turns out that humans are bad at predicting how a computer programme behaves. It makes debugging hard, but it also makes it difficult to predict which part of a programme need optimisation in priority.
To make this task easier, it is possible to use flamegraphs, by Brendan Gregg.
Usually, you need tools such as the perf command (Linux perf) to profile the execution of a programme. However, this command is not available to observe the kernel (or at least, not at the current state of Maestro and not at every stage). So we need to find another solution.
Attempt 1: Poor man’s profiler
I am not going to explain what the poor man’s profiler is since there is a dedicated website for it.
The simplicity of this profiler, along with the presence of a gdb stub in QEMU (and also VMWare) made it an interesting choice.
When running a kernel in QEMU (with the -s option), one can connect to the gdb stub using this command:
(gdb) target remote :1234
And then debug the kernel as if it were a userspace program.
The command connects gdb to port
1234of the local machine using the gdb protocol.For VMWare, the default value is
8832. By the way, I discovered how to use this feature by reading spooky secrets of the CIA on WikiLeaks.
I tried to write a programme that used the gdb protocol to profile the kernel, but it turns out there is a delay between each command that slows down the execution to the point where the guest OS becomes unusable.
So I had to find another solution.
Attempt 2: QEMU plugin
Spoiler: This attempt was successful. Yay!
QEMU TCG (Tiny Code Generator) provides an API for plugins, allowing to observe the execution of the guest.
The API provides direct access to a lot of information, but also lacks a lot of features. In particular:
- Access to the current state of CPU registers
- Access to the guest’s memory
A workaround for these features is to use internal QEMU functions by re-declaring their prototypes.
The plugin works by pausing the execution of the programme at a given sampling frequency. For each sample, the plugin dumps the current callstack to an output file. All the collected callstacks can then be aggregated by another programme.
This tool works by assuming that the more time spent on a function, the higher the probability that it will show up in the callstack when a sample is taken. It is not an exact science though: different runs might produce slightly different flamegraphs.
The guest OS is still slowed down, but it is a lot better than the previous attempt as it remains usable.
For more details, the source code is available here.
Visualise the boot sequence
The following flamegraph (created from this commit) shows the boot sequence, from the entry into the kernel’s code, until bash has started.
The kernel has been compiled in debug mode because compiling in release mode provides too few samples.
You can click on each block to zoom in on them. You can also use the upper-right button to search for a function name.
The bottom blocks are separated because they work on different stacks:
kernel_mainrepresents the execution before entering userspace (starting the first process)event_handler(maybe I should rename this tointerrupt_handlerby the way) represents the execution of code that is triggered when an interruption occurssyscall_handlerrepresents the execution of system calls- the rest are miscellaneous detached stacks that are often required for context switching
Note: An interruption is an event on the system, either internal to the CPU (example: invalid access to memory), or external (examples: pressing a key on the keyboard, the disk is ready for I/O, …).
When the CPU receives an interruption, it suspends the execution of the code to handle the interruption instead. Then, the execution is resumed.
Each interruption has an associated ID allowing to identify it (although it is more complicated nowadays as several components can use the same interruption ID)
System calls also work by triggering an interruption under x86 (32 bits), with the instruction
int 0x80. Under x86_64, thesysenterinstruction is used instead.

Analysis
Now that we have a flamegraph, let’s use it to find which parts of the kernel slow everything down.
A consequence of profiling in debug mode is that a lot of bound checks and overflow checks (that are not present in release mode) are accounted for. It is also the case for certain assertions, notably in memory allocators, increasing their footprints.
The ones I expected
Disk accesses
The kernel spends most of the time reading or writing files. This is due to:
- The absence of a file cache, which forces the kernel to access the disk for every operation on filesystems
- Disk accesses being slow, mainly (but not only) because of the use of Parallel ATA
Also, to get notified when the controller is ready, the driver is using polling (checking the status in a loop, which is very CPU-intensive) rather than idling until an interruption occurs.
ELF parser
The ELF parser is slow because it uses inefficient algorithms to traverse data structures.
For example, finding a symbol by name is done in linear time (O(n)), by traversing all symbols until finding the one that corresponds.
It gets even worse when loading a kernel module: for every “undefined” symbol in the module, the kernel needs to find the corresponding symbol in its own symbol table, which raises the time complexity to quadratic (O(n^2)).
A way to improve it would be to use the internal hashmap provided inside the ELF files, and when not present, to cache the symbols in a hashmap ourselves.
The unexpected ones
This is where the flamegraph becomes really useful.
I was expecting the TTY to take a significant amount of time, but it turns out it almost does not show up on the flamegraph.
strlen
The kernel seems to be spending quite some time (6.6% of the total) in the strlen function. Let’s look at the code (in C):
size_t strlen(const char *s)
{
    size_t n = 0;

    // TODO optimize
    while (s[n])
        ++n;
    return n;
}
Well, yeah… That could be optimised.
In the past, the glibc used special masks to be able to check 4 bytes at a time (or 8, under 64 bits). It also makes sure to respect memory alignment. musl has a similar implementation, although simpler.
Now, glibc seems to be using compiler internals.
Feeding the entropy pool
The entropy pool is a buffer that stores noise to be used by random number generators (for files such as /dev/random or /dev/urandom, or the getrandom system call).
The kernel uses interruptions as noise to feed the pool. Because this can leak data from the system (which is a security issue), I use the ChaCha20 algorithm to make this data unusable.
The problem is that each time an interruption occurs, the kernel recomputes a ChaCha20 block, which is slow. This implementation of the ring buffer also seems to be slow.
Conclusion
This article describes only the first pass of optimisations to make. Once this is fixed, the system will speed up, but other parts of the kernel will show up as being expensive relative to others in the flamegraph.
The more iterations are made, the more optimised the kernel becomes.
While this flamegraph allows to optimise the usage of the CPU, it does not address issues related to memory usage (and in particular, memory leaks). Exploring memory flamegraphs could be the subject of another article.
Contact me: blog@lenot.re
Like my work? Share it! ❤️